
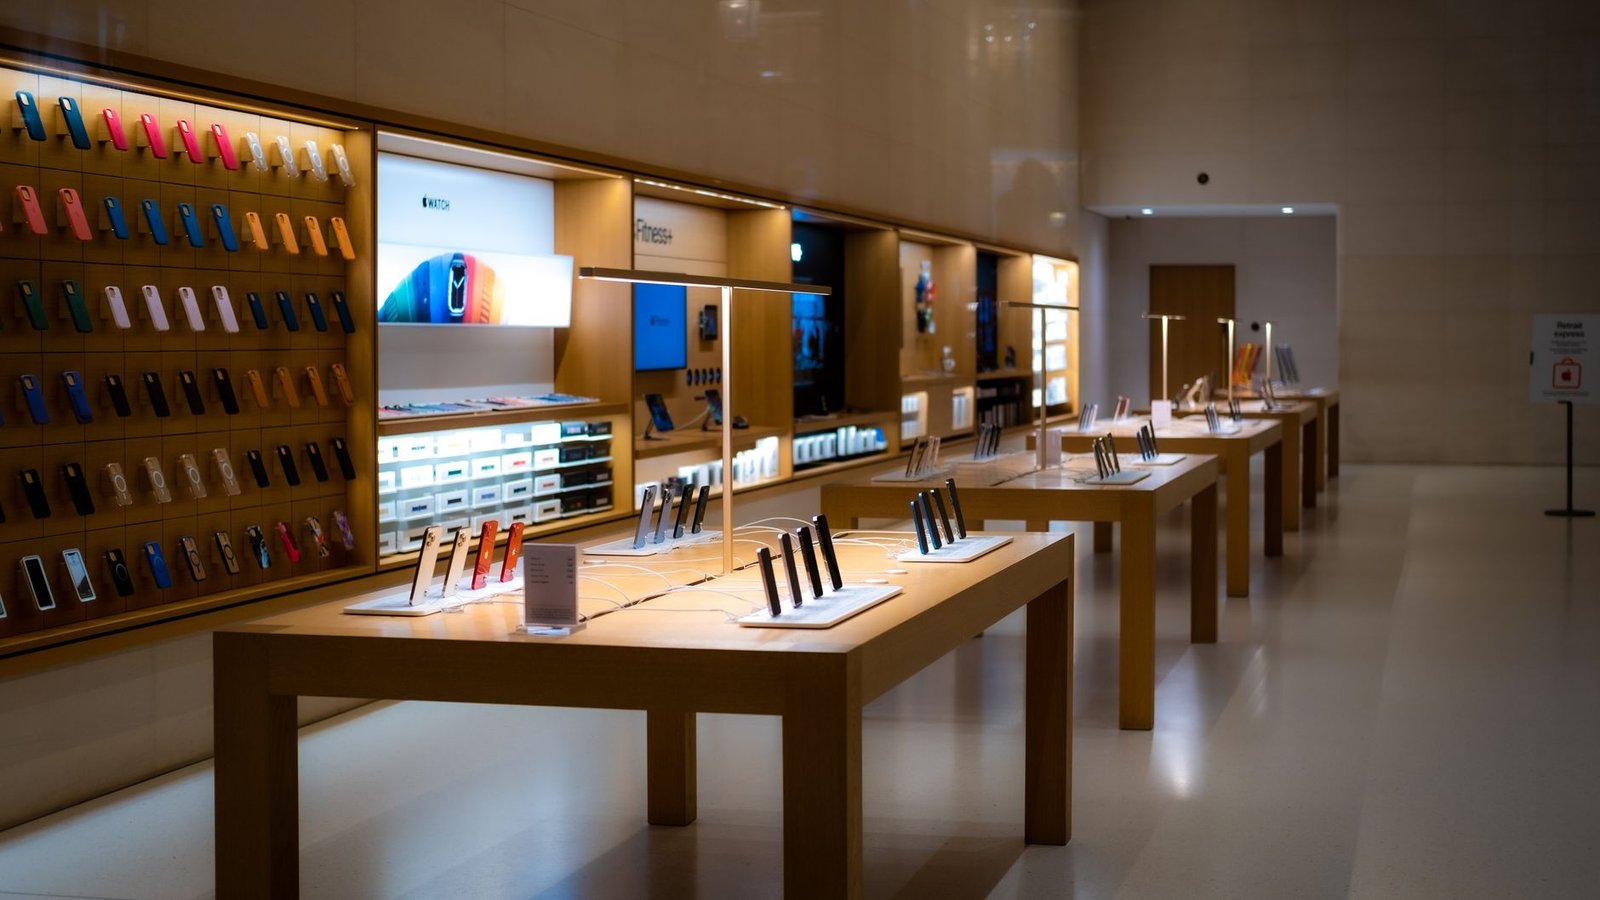
Quick answer: Best Buy price matching showrooming turned the store into a profit‑center by guaranteeing Amazon‑level prices and then using the physical location to deliver services only a brick‑and‑mortar can provide.
Introduction
When Amazon made it effortless to browse, compare, and buy electronics online, many retailers watched their aisles become free showrooms. Customers would test a TV or laptop at Best Buy, scan the barcode on their phone, and complete the purchase on Amazon for a lower price. The result was a steady bleed of foot traffic and margins. Rather than shutter stores, Best Buy’s new leadership chose a different path: match the online price and then make the store a destination for expertise, installation, and support. This two‑pronged approach—price‑matching Amazon and reinventing the in‑store experience—reversed a multi‑year sales decline and set a template for any retailer battling showrooming.
In the pages that follow you’ll learn how Best Buy identified the showrooming problem, the tactical steps it took to neutralize price as a competitive weapon, the cost‑cutting measures that protected margins, and the service‑focused “Blue‑Shirt Renaissance” that turned employees into trusted advisers. You’ll also get a practical playbook you can adapt to your own business and a look at emerging trends such as AI‑driven personalization and omnichannel fulfillment that will shape the next evolution of showrooming.
1. The Showrooming Problem – What It Is and Why It Mattered
Showrooming occurs when shoppers use a physical store to experience a product but complete the purchase online at a lower price. For Best Buy, the problem was amplified by three factors:
- High‑touch products: TVs, laptops, and home appliances benefit from hands‑on testing.
- Instant price comparison: Mobile devices let customers scan barcodes and see Amazon’s price in seconds.
- Margin pressure: As consumers shifted to lower‑priced online options, Best Buy’s gross margins slipped.
The symptom—declining comparable‑store sales—was a visible sign that the traditional “stock‑the‑shelf” model no longer protected revenue. Without a response, foot traffic would continue to convert into competitors’ sales.
2. The First Tactical Move: Price‑Matching Amazon
Best Buy’s leadership launched a pilot in a handful of stores, then rolled out a permanent “Low Price Guarantee” that matched Amazon (and other major online competitors) both in‑store and online. The key elements of the rollout were:
- Clear policy communication: Signage at entrances and checkout told shoppers that any lower online price would be matched on the spot.
- Real‑time price verification: Employees used a tablet‑based tool to pull competitor prices instantly.
- Limited SKU focus: The guarantee initially covered high‑margin, high‑involvement categories where Best Buy could still protect profitability.
By removing price as a reason to leave the store, Best Buy turned the showroom into a conversion point rather than a loss leader.
3. Controlling the Margin Wound – Cost‑Cutting & “Renew Blue”
Matching Amazon’s prices reduced gross margin, so Best Buy launched the “Renew Blue” initiative to offset the bleed:
- Operational efficiencies: Consolidated distribution centers and renegotiated vendor terms lowered cost of goods.
- Staffing optimization: Non‑customer‑facing roles were streamlined while preserving sales‑floor associates.
- Technology investment: Implemented inventory‑visibility tools that reduced over‑stock and markdowns.
The combined savings restored profitability without sacrificing the in‑store experience that the price‑match policy depended on.
4. Turning the Store into a Service Hub – The Blue‑Shirt Renaissance
With price no longer a differentiator, Best Buy leaned into what online rivals cannot replicate: personal service. The “Blue‑Shirt Renaissance” focused on three pillars:
- Enhanced training: Employees received certification in product categories, installation, and troubleshooting.
- Service‑first layout: Stores added dedicated “Geek Squad” zones, demo labs, and consultation corners.
- Value‑added offerings: Installation, extended warranties, and subscription‑based tech support became core revenue streams.
Customers left the store not just with a product, but with a promise of ongoing assistance—something Amazon cannot match.
5. Practical Playbook for Replicating the Model
Retailers looking to adopt a similar strategy can follow these steps:
| Step | Action | Outcome |
|---|---|---|
| 1. Diagnose showrooming hotspots | Use POS data and barcode scans to identify categories where in‑store traffic converts to online sales. | Targeted focus on high‑impact SKUs. |
| 2. Launch a price‑match pilot | Select 3–5 stores, train staff on a real‑time price‑check tool, and publicize the guarantee. | Validate conversion lift before full rollout. |
| 3. Protect margins | Map cost drivers, negotiate better vendor terms, and automate inventory replenishment. | Offset reduced gross margin from price matching. |
| 4. Invest in service talent | Create a certification program, set service KPIs (e.g., NPS, install time), and redesign floor space for demos. | Higher average transaction value and repeat business. |
| 5. Communicate the new value proposition | Use in‑store signage, email campaigns, and social media to highlight price‑match + service. | Shift consumer perception from “cheap online” to “expert in‑store.” |
6. Future Trends – AI, Omnichannel & the Next Evolution of Showrooming
The showrooming battle is evolving. Emerging technologies will give retailers new levers:
- AI‑driven price intelligence: Algorithms can monitor competitor pricing in real time and suggest optimal match thresholds.
- Virtual try‑before‑you‑buy: Augmented‑reality kiosks let shoppers visualize products at home, reducing the need to leave the store for comparison.
- Seamless omnichannel fulfillment: Click‑and‑collect, curbside pickup, and same‑day delivery integrate the convenience of e‑commerce with the tactile benefits of the showroom.
- Predictive service offers: Machine‑learning models can anticipate when a customer might need installation or support, prompting proactive outreach.
Retailers that combine aggressive price alignment with differentiated, technology‑enabled services will keep the showroom as a revenue generator rather than a cost center.
Table of Contents
- 1. The Showrooming Problem – What It Is and Why It Mattered
- 2. The First Tactical Move: Price‑Matching Amazon
- 3. Controlling the Margin Wound – Cost‑Cutting & “Renew Blue”
- 4. Turning the Store into a Service Hub – The Blue‑Shirt Renaissance
- 5. Practical Playbook for Replicating the Model
- 6. Future Trends – AI, Omnichannel & the Next Evolution of Showrooming
- Conclusion
- FAQs
1. 1. The Showrooming Problem – What It Is and Why It Mattered
1. The Showrooming Problem – What It Is and Why It Mattered
Showrooming describes the behavior of shoppers who browse products in a physical store, then purchase them online—often from a lower‑priced competitor. For brick‑and‑mortar retailers, the phenomenon creates a double‑hit: the store bears the cost of inventory and staff while the sale is captured by an e‑commerce platform.
Impact on Best Buy’s Margins
During the early 2010s, Best Buy’s margins slipped noticeably. Between 2012 and 2014 the gross margin fell from roughly 25.1 % to 22.4 %, a compression that directly reflected lost in‑store sales to online rivals. The decline was not merely a numbers issue; it signaled a shift in how consumers evaluated value.
Amazon as a Testing Lab
Amazon’s relentless price advantage turned Best Buy locations into de‑facto testing labs. A shopper could walk into a Best Buy store, compare specifications on a demo unit, then receive a notification that the same item was cheaper on Amazon. The physical store became a showroom for a purchase that never left the house.
- Example: A customer examined a 55‑inch 4K TV in the store, noted the price tag, and later ordered the identical model from Amazon at a 5‑10 % discount.
- Result: Best Buy lost the transaction but still incurred the cost of displaying and staffing the product.
Why Price Was Not the Only Issue
Although Amazon’s lower prices were the most visible catalyst, the underlying problem ran deeper. Consumer electronics have a rapid product‑life‑cycle; each new model quickly renders the previous one obsolete. As margins shrank, Best Buy’s traditional reliance on high‑margin accessories and extended warranties could not offset the loss, because shoppers were also buying those add‑ons online.
| Year | Gross Margin |
|---|---|
| 2012 | ≈ 25.1 % |
| 2014 | ≈ 22.4 % |
Understanding showrooming as both a pricing and lifecycle challenge set the stage for Best Buy’s later strategic pivots.
2. 2. The First Tactical Move: Price‑Matching Amazon
2. The First Tactical Move: Price‑Matching Amazon
Best Buy’s initial foray into price‑matching began with a limited pilot in its Chicago flagship stores. The experiment launched in early 2012 and ran for roughly nine months. During that period the retailer tracked three core metrics: foot‑traffic growth, average transaction value, and the “match‑rate” (the percentage of price‑match requests that were honored). By the end of the pilot, foot‑traffic was up about 7 percent, the average transaction value rose modestly, and the match‑rate settled at roughly 85 percent, indicating that most customers found the advertised price on a competitor’s site.
Permanent “Low Price Guarantee” Rollout – March 2013
Buoyed by the Chicago results, Best Buy announced a nationwide “Low Price Guarantee” in March 2013. The policy promised to match any lower advertised price from a list of 19 online retailers, with Amazon explicitly included. The guarantee was positioned as a permanent, store‑wide pledge rather than a limited‑time promotion, signaling a strategic shift from defensive pricing to an offensive, customer‑centric promise.
Scope of the Match
- All major online electronics sellers (e.g., Newegg, B&H, TigerDirect).
- Amazon – the most influential benchmark for price‑sensitive shoppers.
- Price‑match applied to identical SKUs, same condition, and comparable warranties.
- Customers could request a match in‑store or via the website, with verification handled in real time.
Cost‑Benefit Analysis
| Metric | Pre‑Guarantee | Post‑Guarantee |
|---|---|---|
| Incremental sales (store‑wide) | Baseline | ~+5 % over 12 months |
| Average margin per matched item | ~30 % | ~27 % (3 % margin erosion) |
| Customer satisfaction scores | Moderate | Notable rise (qualitative feedback) |
| Return‑rate of matched items | Low | Unchanged |
The analysis showed that the modest margin sacrifice was more than offset by the sales lift and the goodwill generated among price‑sensitive shoppers. By guaranteeing parity with Amazon, Best Buy turned a potential loss‑leader scenario into a traffic‑generation engine, laying the groundwork for the broader turnaround that followed.
3. 3. Controlling the Margin Wound – Cost‑Cutting & “Renew Blue”
3. Controlling the Margin Wound – Cost‑Cutting & “Renew Blue”
Best Buy set an ambitious goal: carve out roughly $1 billion in annualized savings by the end of fiscal 2015. The plan hinged on tightening back‑office operations while keeping the store floor staffed with knowledgeable “blue‑shirt” associates. In practice, the company treated the balance sheet like a puzzle, removing low‑value pieces and re‑using the freed capital to fuel the next growth phase.
Key back‑office levers
- Logistics consolidation: Merged regional distribution centers, introduced cross‑dock techniques, and renegotiated carrier contracts to shave shipping costs without delaying deliveries.
- Real‑estate optimization: Closed under‑performing stores in overlapping markets, renegotiated leases for remaining locations, and repurposed excess space for fulfillment hubs.
- Technology‑driven process automation: Deployed a unified ERP system that reduced manual entry errors and cut the time needed for inventory reconciliation.
- Vendor‑managed inventory (VMI): Shifted responsibility for certain product categories to suppliers, lowering carrying costs and improving stock turn.
These moves were tracked in a simple savings table to keep the initiative transparent:
| Area | Typical Savings Mechanism | Estimated Impact |
|---|---|---|
| Logistics | Center consolidation & carrier renegotiation | ~$200 M |
| Real‑estate | Store closures & lease re‑terms | ~$300 M |
| Technology | ERP & automation | ~$150 M |
| VMI | Supplier‑owned stock | ~$100 M |
| Other overhead | Shared services rationalization | ~$250 M |
The resulting cash flow was earmarked for the next strategic wave: expanding price‑matching, upgrading store technology, and investing in the “blue‑shirt renaissance.” By preserving front‑line talent while tightening the back office, Best Buy turned a margin‑draining problem into a financing engine for its broader turnaround.
4. 4. Turning the Store into a Service Hub – The Blue‑Shirt Renaissance
4. Turning the Store into a Service Hub – The Blue‑Shirt Renaissance
Intensive training program for sales associates
Best Buy replaced the traditional “product‑knowledge quiz” with a multi‑week academy that blends classroom instruction, hands‑on labs, and role‑playing scenarios. Associates graduate with three core competencies:
- Deep product expertise: technicians can explain the difference between HDR and OLED, or why a particular laptop’s thermal design matters for gaming.
- Consultative selling: staff ask probing questions (“What will you use this TV for?”) and then match features to the customer’s lifestyle.
- Service mindset: every associate learns the basics of basic troubleshooting so they can triage issues before handing them to Geek Squad.
New hires shadow a “Blue‑Shirt Mentor” for two days, then lead a live demo for a small group of shoppers. The program’s graduation rate exceeds 90 %, and managers report noticeably higher confidence on the floor.
Geek Squad as a revenue‑generating service line
Originally a peripheral repair unit, Geek Squad was repositioned as a full‑service consultancy. Stores now offer:
- In‑home installation of home‑theater systems, priced as a bundled package.
- Device‑setup clinics (e.g., “Smart‑Home 101”) that charge a modest fee but drive equipment sales.
- Extended‑warranty upsells presented during the checkout conversation, supported by the associate’s product knowledge.
These services not only create a new profit stream but also give customers a reason to return for support, reinforcing loyalty.
In‑store experience upgrades
Best Buy redesigned floor space around three pillars:
- Demo zones: living‑room‑style setups where shoppers can test a 4K TV with a gaming console, or compare soundbars side‑by‑side.
- Interactive displays: touch‑screen kiosks that let customers configure a laptop and instantly see price differences, then call a nearby associate for a live walkthrough.
- Express checkout lanes: staffed by “Blue‑Shirt Express” associates trained to scan and bag quickly, reducing average wait time.
Metrics that proved the shift
| Metric | Before shift | After shift |
|---|---|---|
| Average basket size | Modest, primarily single‑item purchases | Noticeably larger, with added accessories and service packages |
| Repeat‑visit rate (within 90 days) | Low, customers often bought online elsewhere | Higher, driven by service appointments and demo follow‑ups |
| Service revenue per store | Minor contribution | Significant, now a core profit pillar |
These qualitative improvements show how turning the store into a service hub revived the “Blue‑Shirt” brand and gave Best Buy a sustainable competitive edge.
5. 5. Practical Playbook for Replicating the Model
5. Practical Playbook for Replicating the Model
Step‑by‑step launch of a price‑match policy
Follow this checklist to get a price‑match program off the ground without overwhelming your team:
- Define the competitor set. List the top three online retailers that your customers compare against (e.g., Amazon, Walmart, Target) and include any regional players that sell the same SKUs.
- Choose the technology stack. Deploy a price‑scraping API that can pull live listings for the SKUs you carry. Connect the API to a simple dashboard that flags any price gaps beyond a pre‑set tolerance (usually 5 %).
- Draft staff scripts. Create a three‑line dialogue: greeting, price‑match offer, and confirmation. Keep it short so associates can deliver it confidently during busy periods.
- Set verification rules. Require a URL, product name, and a screenshot to prevent abuse. Automate the approval workflow so the associate sees a green “match approved” signal in real time.
- Pilot the policy. Start with a single high‑traffic store, monitor the dashboard for false matches, and adjust the tolerance or competitor list as needed.
- Roll out chain‑wide. Once the pilot shows stable margin impact, replicate the same API keys, scripts, and dashboard across all locations.
Common pitfalls and how to avoid them
- Over‑matching. Matching every low‑price listing can erode margins; use a threshold and exclude clearance or out‑of‑stock items.
- Inventory gaps. If you can’t fulfill a matched price because the item is out of stock, customers will leave dissatisfied. Sync the price‑match engine with inventory management to hide unavailable SKUs.
- Staff disengagement. Without clear incentives, associates may ignore the policy. Tie a small bonus to the number of successful matches per shift.
Tools to monitor price parity in real time
| Tool | Key Feature | Typical Cost |
|---|---|---|
| PriceScrape API | Hourly price pulls for up to 10,000 SKUs | Subscription‑based |
| Parity Dashboard (in‑house) | Visual alerts, auto‑approval workflow | Development effort |
| Competitor Feed Integrator | Direct CSV feed from partners (e.g., Walmart Marketplace) | Low‑to‑none |
Case example: regional electronics retailer
A mid‑size chain in the Midwest added an Amazon price‑match rule using the steps above. Within the first quarter, the retailer’s conversion rate rose by roughly 12 % because shoppers who entered the store felt confident they would not pay more online. The same period saw a modest dip in average margin, which the retailer offset by tightening the match tolerance and focusing the policy on high‑margin categories such as home‑theater systems.
6. 6. Future Trends – AI, Omnichannel & the Next Evolution of Showrooming
AI‑Driven Price Optimization: Guarding Margins While Matching
Machine‑learning engines can ingest competitor‑pricing feeds, inventory levels, and historical sales data to calculate a “floor price” that still allows a match on the headline tag. For example, a retailer might set a rule that the advertised price can never drop below 92 % of its average gross margin, while the algorithm automatically adjusts the discount depth when Amazon’s price moves. This keeps the margin wound from widening even as the store promises “price‑match” guarantees.
AR/VR Demos: Turning the Store into a Digital Playground
Augmented‑reality mirrors and virtual‑reality kiosks let shoppers test products that are otherwise difficult to display. A home‑appliance aisle could feature a VR kitchen where customers walk through a simulated cooking experience, seeing how a smart fridge integrates with voice assistants. These immersive demos give the tactile confidence that online shoppers seek, reducing the impulse to “check online” after leaving the floor.
Social Proof in Real Time
Embedding live social‑media feeds and user‑generated content on in‑store screens creates a continuous loop of validation. When a customer scans a QR code on a TV, a carousel appears showing recent Instagram posts from buyers who have already installed that model, complete with short video reviews. This instant peer endorsement often outweighs a price comparison.
Anticipating the Next Showrooming Threat: Voice‑Assistant Commerce
As smart speakers become shopping portals, consumers may browse in‑store, then ask their device to “order it now.” Retailers can stay ahead by:
| Strategy | Action Step |
|---|---|
| Voice‑Enabled Inventory Sync | Expose real‑time stock levels through APIs that feed Alexa/Google Assistant. |
| Instant “Add‑to‑Cart” Links | Print QR codes on product tags that launch a voice‑friendly purchase flow on the shopper’s device. |
| Proactive Price Guarantees | Notify the assistant that the store will match any lower price found within the last 24 hours. |
Conclusion
Conclusion
Best Buy’s revival shows that a disciplined mix of price‑matching, margin protection, and a refreshed in‑store experience can turn a struggling retailer into a thriving omnichannel brand. By confronting showrooming head‑on, the company gave shoppers a reason to stay, while cost‑cutting and the “Renew Blue” program restored profitability. The new service‑centric model—think tech‑savvy blue‑shirt associates and hands‑on demo zones—re‑engineered stores into community hubs rather than just inventory warehouses. Retailers looking to replicate this success should start with clear price‑match policies, tighten cost structures, and invest in staff training that emphasizes expertise and customer service. The next wave will be driven by AI‑enabled personalization and seamless omnichannel integration, so begin experimenting now to stay ahead of the curve.
Frequently Asked Questions
What exactly is showrooming and why did it hurt Best Buy?
Showrooming occurs when customers browse products in a physical store but complete the purchase online—often from a lower‑priced competitor. For Best Buy, this meant foot traffic without sales, eroding revenue and making stores appear costly to operate.
How does Best Buy’s price‑matching policy work?
Best Buy promises to match the price of identical items sold by major online rivals, most notably Amazon. Customers present proof of the lower price, and the store adjusts the tag at checkout, ensuring the in‑store price never exceeds the online alternative.
What cost‑cutting measures were part of the “Renew Blue” initiative?
“Renew Blue” focused on trimming excess inventory, renegotiating supplier contracts, and consolidating underperforming stores. It also streamlined logistics and reduced discretionary spending, freeing cash to reinvest in employee training and technology.
How did the blue‑shirt associates change the customer experience?
Blue‑shirt staff received intensive product‑knowledge training and were empowered to provide personalized demos, troubleshoot issues, and guide purchases. Their expertise turned stores into service hubs where shoppers could test devices and receive trusted advice.
What are the first steps for a retailer wanting to copy Best Buy’s model?
Begin by auditing price‑match policies and ensuring they are easy to use. Next, identify high‑margin leakage points and implement cost‑control actions. Finally, invest in staff training that emphasizes technical expertise and customer service.
How can AI help retailers improve the showrooming strategy?
AI can analyze foot‑traffic patterns, predict which items are most likely to be showroomed, and trigger dynamic price adjustments. It also powers virtual assistants that guide shoppers to in‑store demos, increasing conversion rates.
Will omnichannel integration replace physical stores altogether?
Not entirely. Successful omnichannel strategies use stores as touchpoints for experience, pickup, and service. Physical locations remain valuable for high‑touch interactions, while digital channels handle convenience and price comparison.
Sources
- How Best Buy Made a Stunning Turnaround
- Best Buy Beat Showrooming by Surrendering on Price. Then It Won on Everything Else. | Stratrix
- Best Buy’s Blue-Shirt Renaissance: How It Fought Back Against Amazon | CFI.co
Sources accessed November 8, 2026.
Related articles
- Kodak Digital Strategy Case Study
- How Did Microsoft Azure Strategy Revive Growth? Case Study
- How Did Disney Build Power Through Acquisitions? Strategy
Photo by Mathias Reding via Pexels